Discover how Salesforce Analytics Cloud simplifies data visualization, helping teams turn raw business data into clear, actionable insights.
In today’s fast-moving business world, data isn’t just numbers on a screen—it’s the backbone of decisions, strategies, and success stories. Whether you’re a budding data analyst or part of a seasoned business intelligence team, learning how to harness that data can turn guesswork into insight.
That’s where Salesforce Analytics Cloud steps in. This guide will break down the essentials, so you can start turning data into clear, actionable visuals without feeling buried under technical jargon.
What is Salesforce Analytics Cloud?
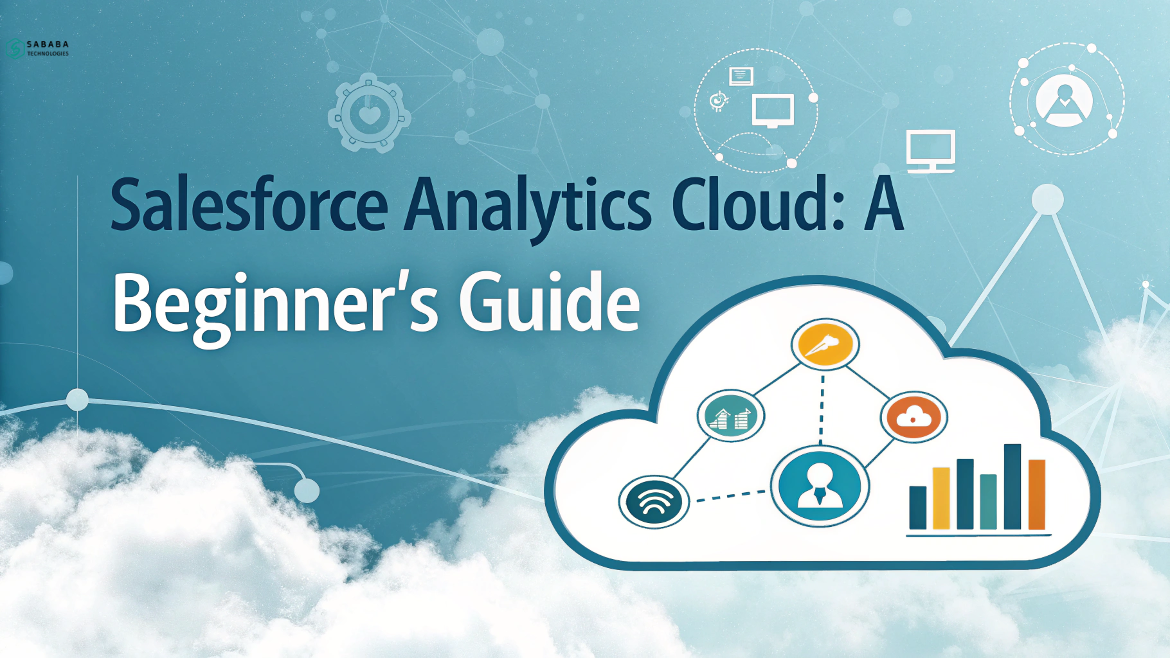
At its core, Salesforce Analytics Cloud is a robust business intelligence platform designed to help organizations visualize and interpret their data with ease. Built on Salesforce’s trusted infrastructure, it goes beyond static reports by offering dynamic dashboards, deep data exploration, and AI-powered insights.
If you’ve ever stared at spreadsheets, wondering how to pull meaning from rows of figures, Analytics Cloud is your new best friend. It transforms numbers into narratives.
Why Choose Salesforce Analytics Cloud for Data Visualization?
So, why should data analysts and business intelligence teams care about this platform? Let’s unpack the advantages:
- Seamless Salesforce Integration: Naturally, if you already use Salesforce CRM, Analytics Cloud feels like a native extension.
- Real-Time Data Updates: No more relying on outdated reports. Get fresh data as it happens.
- AI-Driven Insights: Embedded Einstein Analytics predicts trends, highlights anomalies, and surfaces opportunities you might overlook.
With all these features bundled in, Salesforce Analytics Cloud takes data visualization from confusing to clear.
Key Features That Set Salesforce Analytics Cloud Apart
While many BI tools claim to simplify data, Salesforce Analytics Cloud backs it up with solid features. Here’s a closer look:
1. Interactive Dashboards
Forget static charts. Analytics Cloud delivers dashboards you can play with—filter data, drill down into specifics, or zoom out for the big picture. It’s like upgrading from a black-and-white TV to full 4K.
2. AI-Enhanced Analytics
The Einstein AI engine embedded within the platform doesn’t just provide data—it suggests what that data means. Expect intelligent alerts about upcoming trends or potential business risks.
3. Mobile Accessibility
In a hybrid work environment, flexibility matters. Salesforce Analytics Cloud lets you track KPIs or monitor sales from your phone during that morning coffee run.
4. Data Security at Scale
Security’s not an afterthought here. Built on Salesforce’s renowned secure architecture, it ensures your sensitive business intelligence remains protected.
Getting Started with Salesforce Analytics Cloud
Now, let’s map out how to dip your toes into Salesforce Analytics Cloud without feeling overwhelmed:
Step 1: Connect Your Data
Before anything else, connect the platform to your Salesforce org or external datasets like CSVs or third-party apps. Integration is smooth, thanks to intuitive connectors.
Step 2: Build Your First Dashboard
Start small. Pick a dataset that matters to your role—maybe quarterly sales or customer feedback scores—and experiment with different visualization types.
Step 3: Apply Filters and Widgets
The more personalized your dashboard, the more powerful it becomes. Use filters to slice data, and drag widgets to arrange your visuals neatly.
Step 4: Share and Collaborate
Insights are more impactful when shared. Whether it’s a marketing strategy or sales projection, export your dashboards or invite your team to view live updates.
How Salesforce Analytics Cloud Enhances Business Intelligence
Business intelligence is more than just pretty charts; it’s about making faster, smarter decisions. Here’s how this tool supports real business scenarios:
- Spotting revenue dips before they become crises.
- Understanding which products resonate with specific customer groups.
- Forecasting future trends using historical patterns.
By turning complicated data into compelling visuals, this platform gives decision-makers clarity when it matters most.
Best Practices for Using Salesforce Analytics Cloud
To truly maximize your use of this tool, follow these tips:
- Start with clear goals. Know what you’re looking to uncover before building dashboards.
- Leverage collaboration. Encourage input from colleagues across teams to avoid data blind spots.
- Update regularly. Make a habit of refreshing your dashboards so your data stays relevant.
- Stay curious. Use the platform to explore—not just report—your business metrics.
Final Thoughts
In a world already brimming with information, this tool not only helps turn the chaos of data into confidence but also ensures you stay focused on what matters. After all, it’s not just about charts—it’s about true clarity. And once you finally get comfortable with it, you’ll quickly realize how you ever made decisions without it is a mystery.
Getting started with this platform is your ticket to a smarter, more visual way of handling business data. With dynamic dashboards, real-time updates, and AI-powered insights, it brings data visualization within everyone’s reach. Whether you’re deep into analytics or just stepping in, it’s a platform designed to simplify complexity and boost confidence in your decisions.
FAQs
1. What is Salesforce Analytics Cloud used for?
This platform is used for analyzing, visualizing, and interpreting complex business data through interactive dashboards and AI-driven insights.
2. Is this platform suitable for beginners?
Absolutely. It’s designed with user-friendly features, making it accessible even for those just starting with data visualization.
3. How does Analytics Cloud handle external data?
It allows seamless integration with external data sources like Excel, CSV files, and even third-party cloud platforms.
4. Does this platform offer predictive analytics?
Yes! With the help of Einstein AI, it provides predictive analytics, helping businesses forecast trends and opportunities.
5. Can I access this platform on mobile?
Definitely. Its mobile app ensures you can track and explore your business metrics on the go.
Feeling more like puzzles than solutions? That’s when Sababa steps in.
At Sababa Technologies, we’re not just consultants, we’re your tech-savvy sidekicks. Whether you’re wrestling with CRM chaos, dreaming of seamless automations, or just need a friendly expert to point you in the right direction… we’ve got your back.
Let’s turn your moments into “Aha, that’s genius!”
Chat with our team or shoot us a note at support@sababatechnologies.com. No robots, no jargon, No sales pitches —just real humans, smart solutions and high-fives.
P.S. First coffee’s on us if you mention this blog post!


