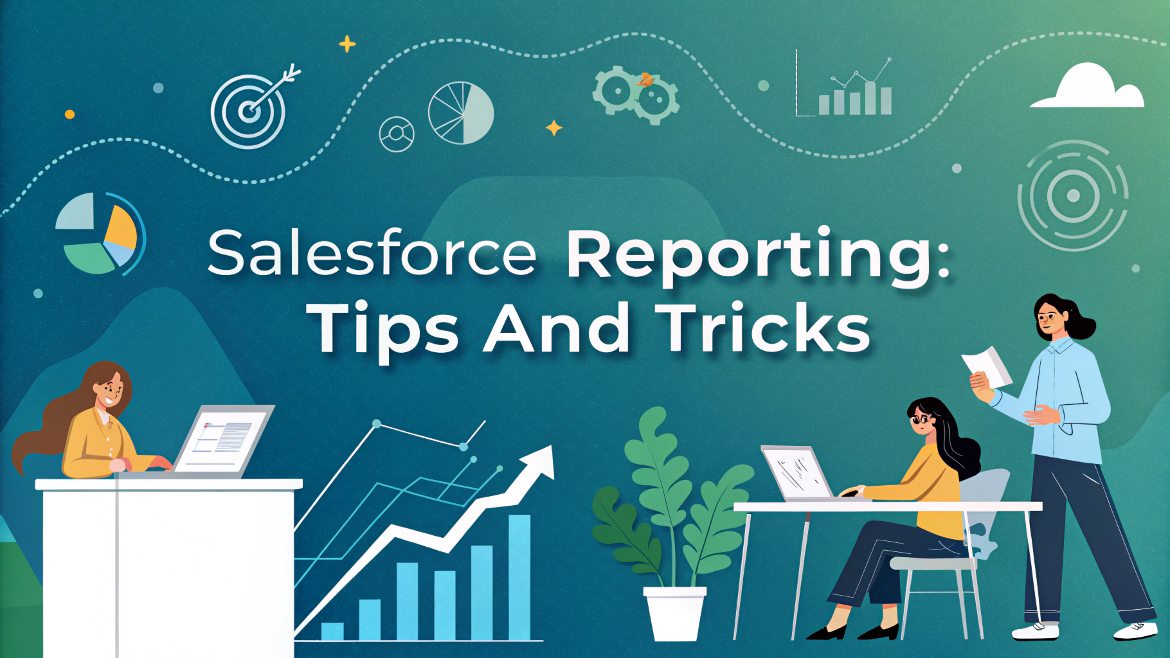
Unlock the power of Salesforce Reporting with these expert tips and tricks! Learn how to enhance your reports, streamline data analysis, and make informed business decisions.
Introduction
Salesforce is an incredibly powerful Customer Relationship Management (CRM) tool, and one of its standout features is its robust reporting capabilities. For businesses that rely on data-driven decision-making, mastering Salesforce reporting is a key to unlocking insights and optimizing processes. However, many users often underutilize these reporting tools, unaware of the full potential at their fingertips. In this blog post, we’ll dive deep into the tips and tricks that can elevate your Salesforce reporting game, helping you make the most out of this powerful CRM platform. Whether you’re a beginner or an experienced user, these expert tips will guide you in creating reports that deliver real-time value.
1. Understand the Basics of Salesforce Reporting
Before diving into advanced tips and tricks, it’s important to ensure that you understand the foundation of Salesforce reports. Salesforce offers a variety of reports, such as tabular, summary, matrix, and joined reports, each suited for different purposes.
- Tabular Reports: Best for simple lists of records.
- Summary Reports: Useful for grouping data and adding subtotals.
- Matrix Reports: Provide a two-dimensional view of your data.
- Joined Reports: Allow you to combine data from multiple sources for more complex analysis.
By understanding these basic report types, you can determine which one fits your needs for any given situation.
2. Leverage Custom Report Types
Salesforce comes with standard report types, but as your business evolves, you’ll likely require more complex reports. In such cases, custom report types allow you to tailor reports to your unique needs. With custom report types, you can:
- Combine data from different objects, such as Opportunities and Accounts.
- Control what fields appear and which are hidden.
- Ensure that reports are specific to your business processes.
Creating custom report types can be an incredibly useful tool to ensure that you’re pulling the exact data you need, saving you time in the long run.
3. Use Report Filters to Drill Down into Data
Filters are an essential tool for narrowing down data within your reports. By setting filters, you can zero in on the specific data points that matter most to your business. Salesforce allows you to use both standard and dynamic filters to refine your reports:
- Standard Filters: These let you filter data based on predefined criteria such as “Close Date” or “Account Type.”
- Dynamic Filters: These filters adjust automatically based on report criteria or user input. For example, a dynamic filter might allow you to generate reports for the last 30 days based on today’s date.
Using filters effectively can help you eliminate irrelevant data, giving you focused, actionable insights.
4. Master Conditional Highlighting for Visual Impact
Visualizing your data makes it easier to spot trends, and Salesforce’s Conditional Highlighting feature can help you do just that. This tool allows you to automatically apply colors to specific values or ranges of values, making your reports more intuitive and easier to read. For instance, you could use:
- Green for deals that are closed.
- Red for overdue tasks.
- Yellow for deals in progress.
This added visual cue makes it easier for decision-makers to spot key information at a glance and take quick action when needed.
5. Utilize Dashboards for Real-Time Insights
While reports give you a snapshot of your data, Salesforce Dashboards take it to the next level by allowing you to visualize data from multiple reports in one place. Dashboards are ideal for executives and managers who need a high-level overview of key performance metrics, as they allow you to track trends, KPIs, and other vital statistics in real time.
To optimize your dashboard experience:
- Use dynamic dashboards that adjust according to who’s viewing them.
- Include multiple report components (charts, graphs, tables) to give a comprehensive view of your data.
- Keep your dashboards clean and focused, highlighting the most important data points to avoid information overload.
6. Automate Report Scheduling and Distribution
If you’re frequently running the same reports, automating the scheduling and distribution of reports can save you significant time. Salesforce allows you to set up scheduled reports that can be delivered to specific users on a recurring basis, whether that’s daily, weekly, or monthly. This feature is particularly useful for managers who need consistent, updated reports without manually running them every time.
Additionally, you can schedule reports to be sent via email, so your team always has the latest data without needing to log in to Salesforce.
7. Export Reports to Excel for Further Analysis
While Salesforce reporting is robust, there may be times when you need to conduct deeper analysis using external tools like Excel. Fortunately, Salesforce allows you to easily export your reports to Excel, where you can apply advanced formulas, pivot tables, and other analytics features to dive deeper into your data.
Exporting to Excel also gives you the flexibility to share reports with stakeholders who may not have access to Salesforce, providing them with a customized view of your business metrics.
Conclusion
Salesforce reporting is an incredibly powerful tool that can significantly improve your decision-making, enhance data visibility, and streamline business processes. By mastering these tips and tricks—whether it’s creating custom report types, leveraging conditional highlighting, or automating your reports—you can ensure that you’re getting the most value from your Salesforce investment.
Remember, the key to effective reporting is understanding the needs of your team and tailoring your reports to deliver actionable insights that drive results. By applying these strategies, you’ll be well on your way to becoming a Salesforce reporting expert, capable of unlocking new opportunities and enhancing your organization’s performance.
Explore More Articles:


